Guide to CRUCS
Updated for version 1.2.0 2024-06-09CRUCS is a tool you can use to create profile coffee roasting plans.
Table of Contents
Requirements
While CRUCS should be usable on any recent web browser on any device, it's most useful on a computer with a keyboard and a pointing device such as a mouse or trackpad. If you have difficulty using this on a device with a touch screen, try zooming in.
Printing
Updated for 1.2.0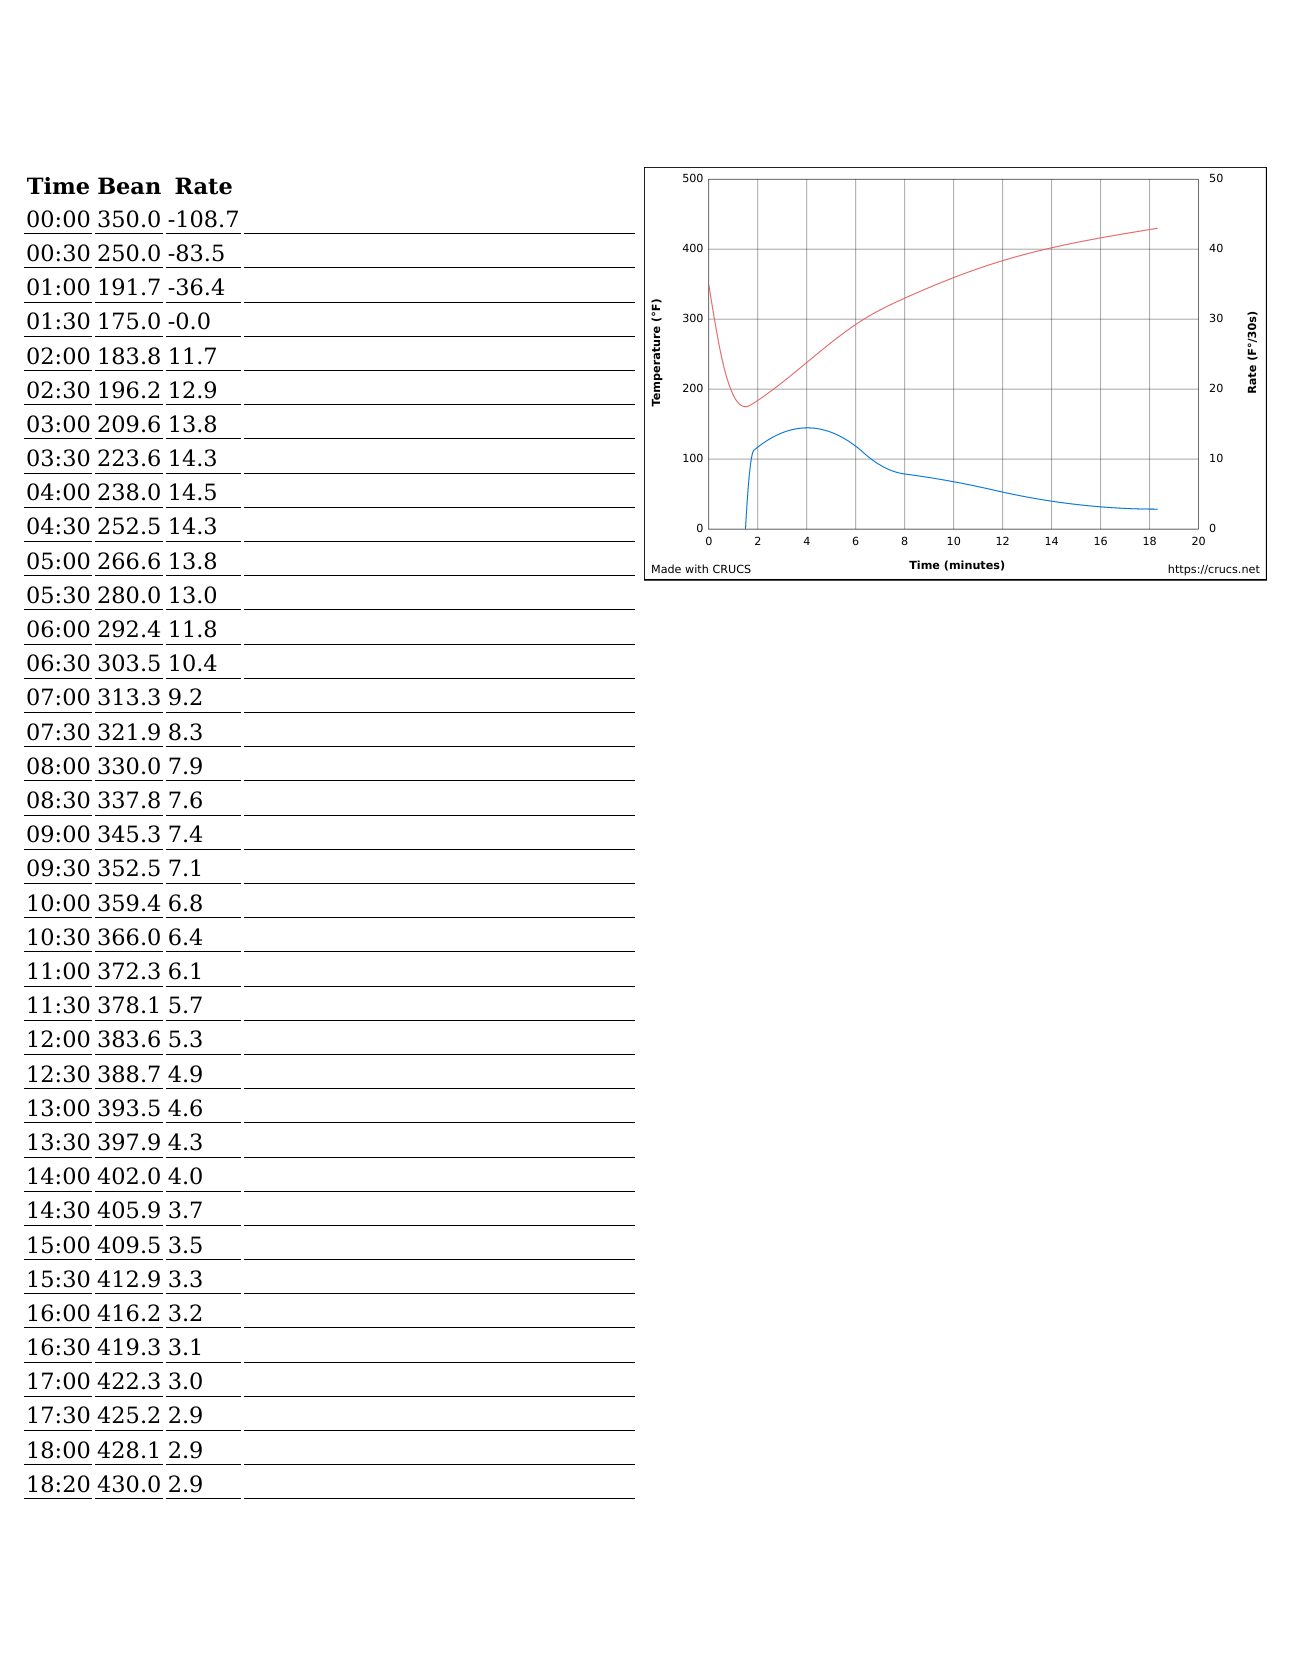
CRUCS can be used to create roasting plans even if you don't intend to use other data logging software at the roaster. The maximum duration roasting plan that will fit on a single page may vary depending on the system fonts, but in testing this was at least 20 minutes when printing on US Letter paper, longer on A4.
Extra space is added at the top of the page so the printout can be placed in most clipboards without the clip hiding any data. There is also considerable empty space on the right of the page below the graph that can be used to write in anything you may find useful such as tasting notes or batch size data.
The data table provides lines extending across about half of the page width. This allows you to write in your own measurements to compare against the plan.
When in the Analysis menu, the analysis ranges will be printed instead of the roasting plan. To print the roasting plan, select any other menu before attempting to print.
Themes
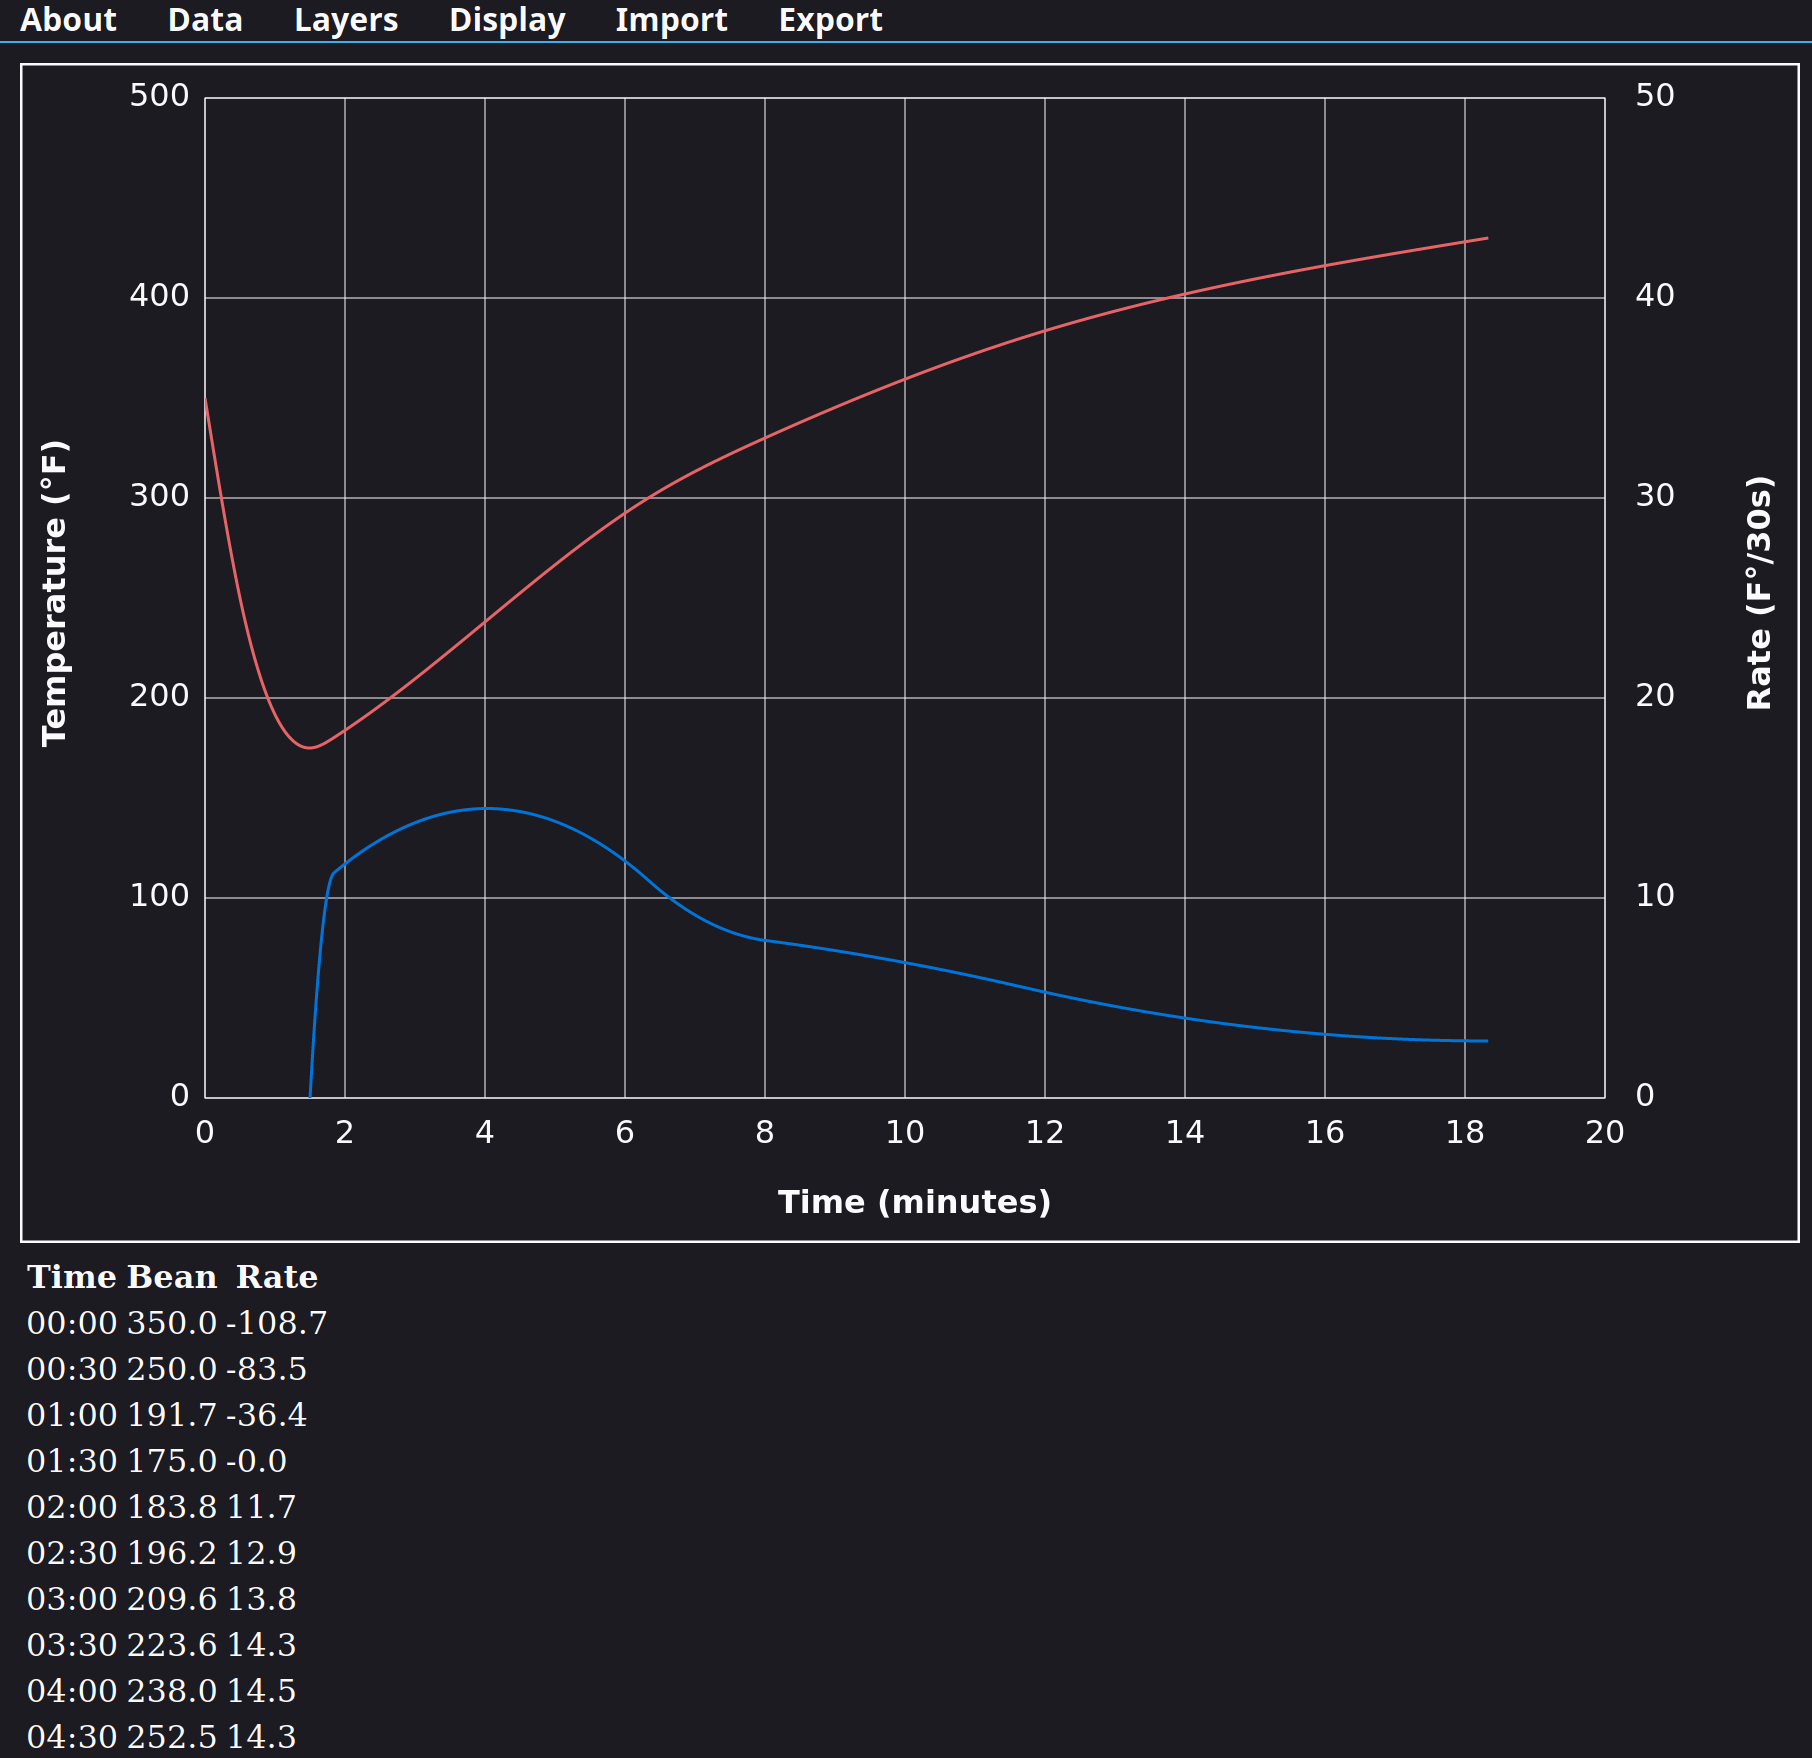
CRUCS uses fonts and colors from your browser and system settings. This means that it will appear different on different operating systems and different web browsers. The most obvious difference is that this will use a light or dark theme to match your system theme settings.
The About Menu
Updated for 1.2.0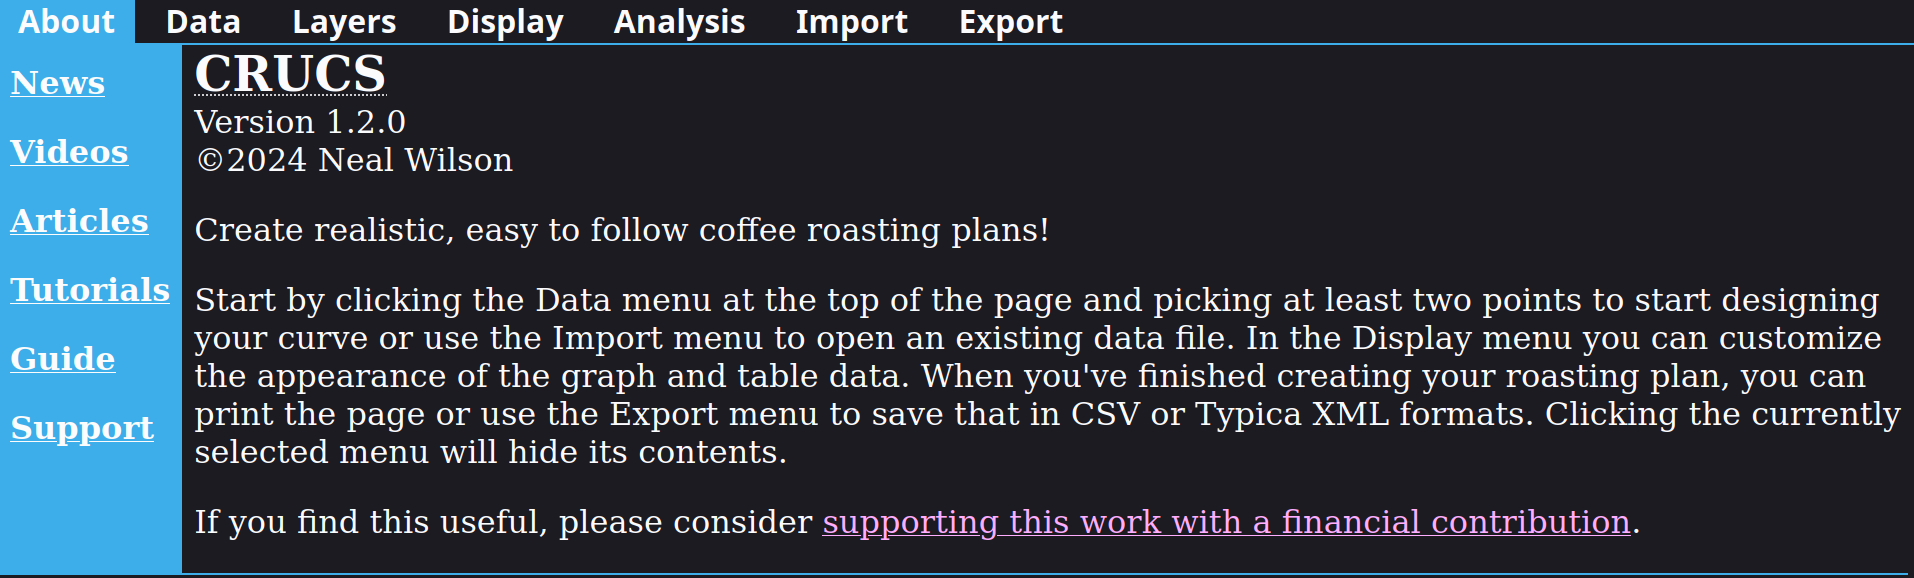
This menu is selected when first opening CRUCS. A column of links on the left points to other pages on the site.
News points to a page containing news about the project. This is mainly release notes. If you see that the version number has changed, this is a good place to see what's new.
Videos is a place to see videos showing CRUCS in use.
Articles points to a list of informative articles.
Tutorials points to a list of step by step guides to different ways of using CRUCS.
Guide points to the guide you're reading now.
Support opens a page where you can send money to support CRUCS. While CRUCS is free to use, there are costs associated with making this available. There is also a place to leave me a message. Words of encouragement are always appreciated. If this is used to report bugs or request features, I'll be tracking amounts paid associated with each issue. No promises on future development, but if lots of people are sending lots of money with the same suggestions I'll take that as a strong signal to direct attention there.
To the right of these links you'll find the current version number and some quick start instructions.
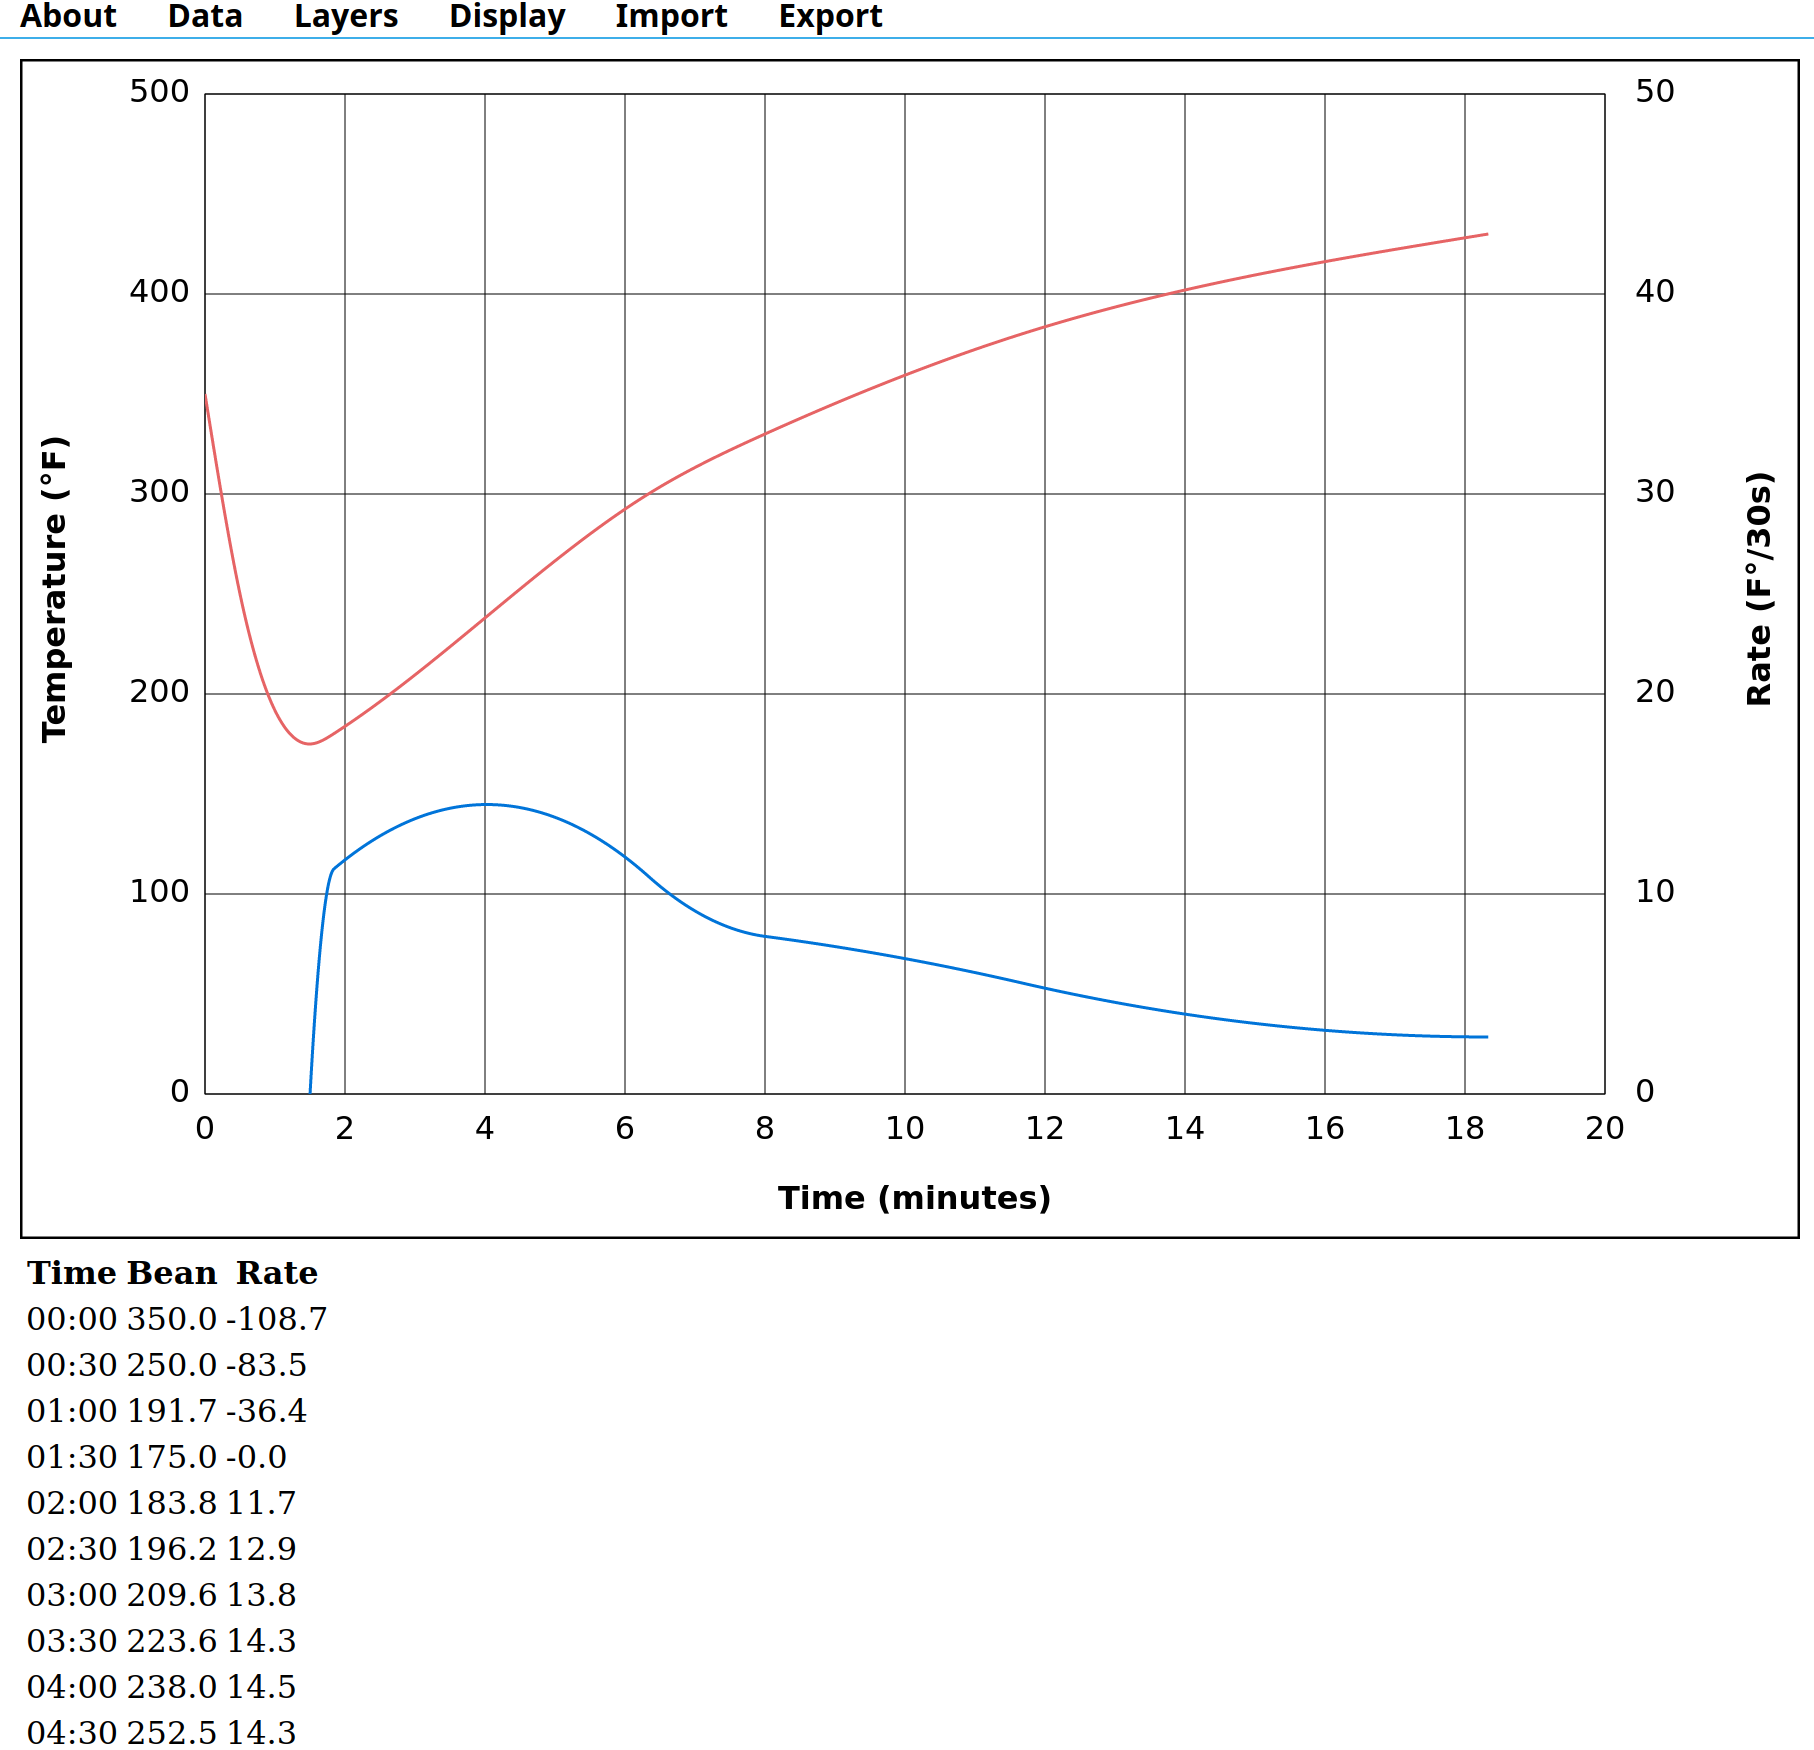
The Data Menu
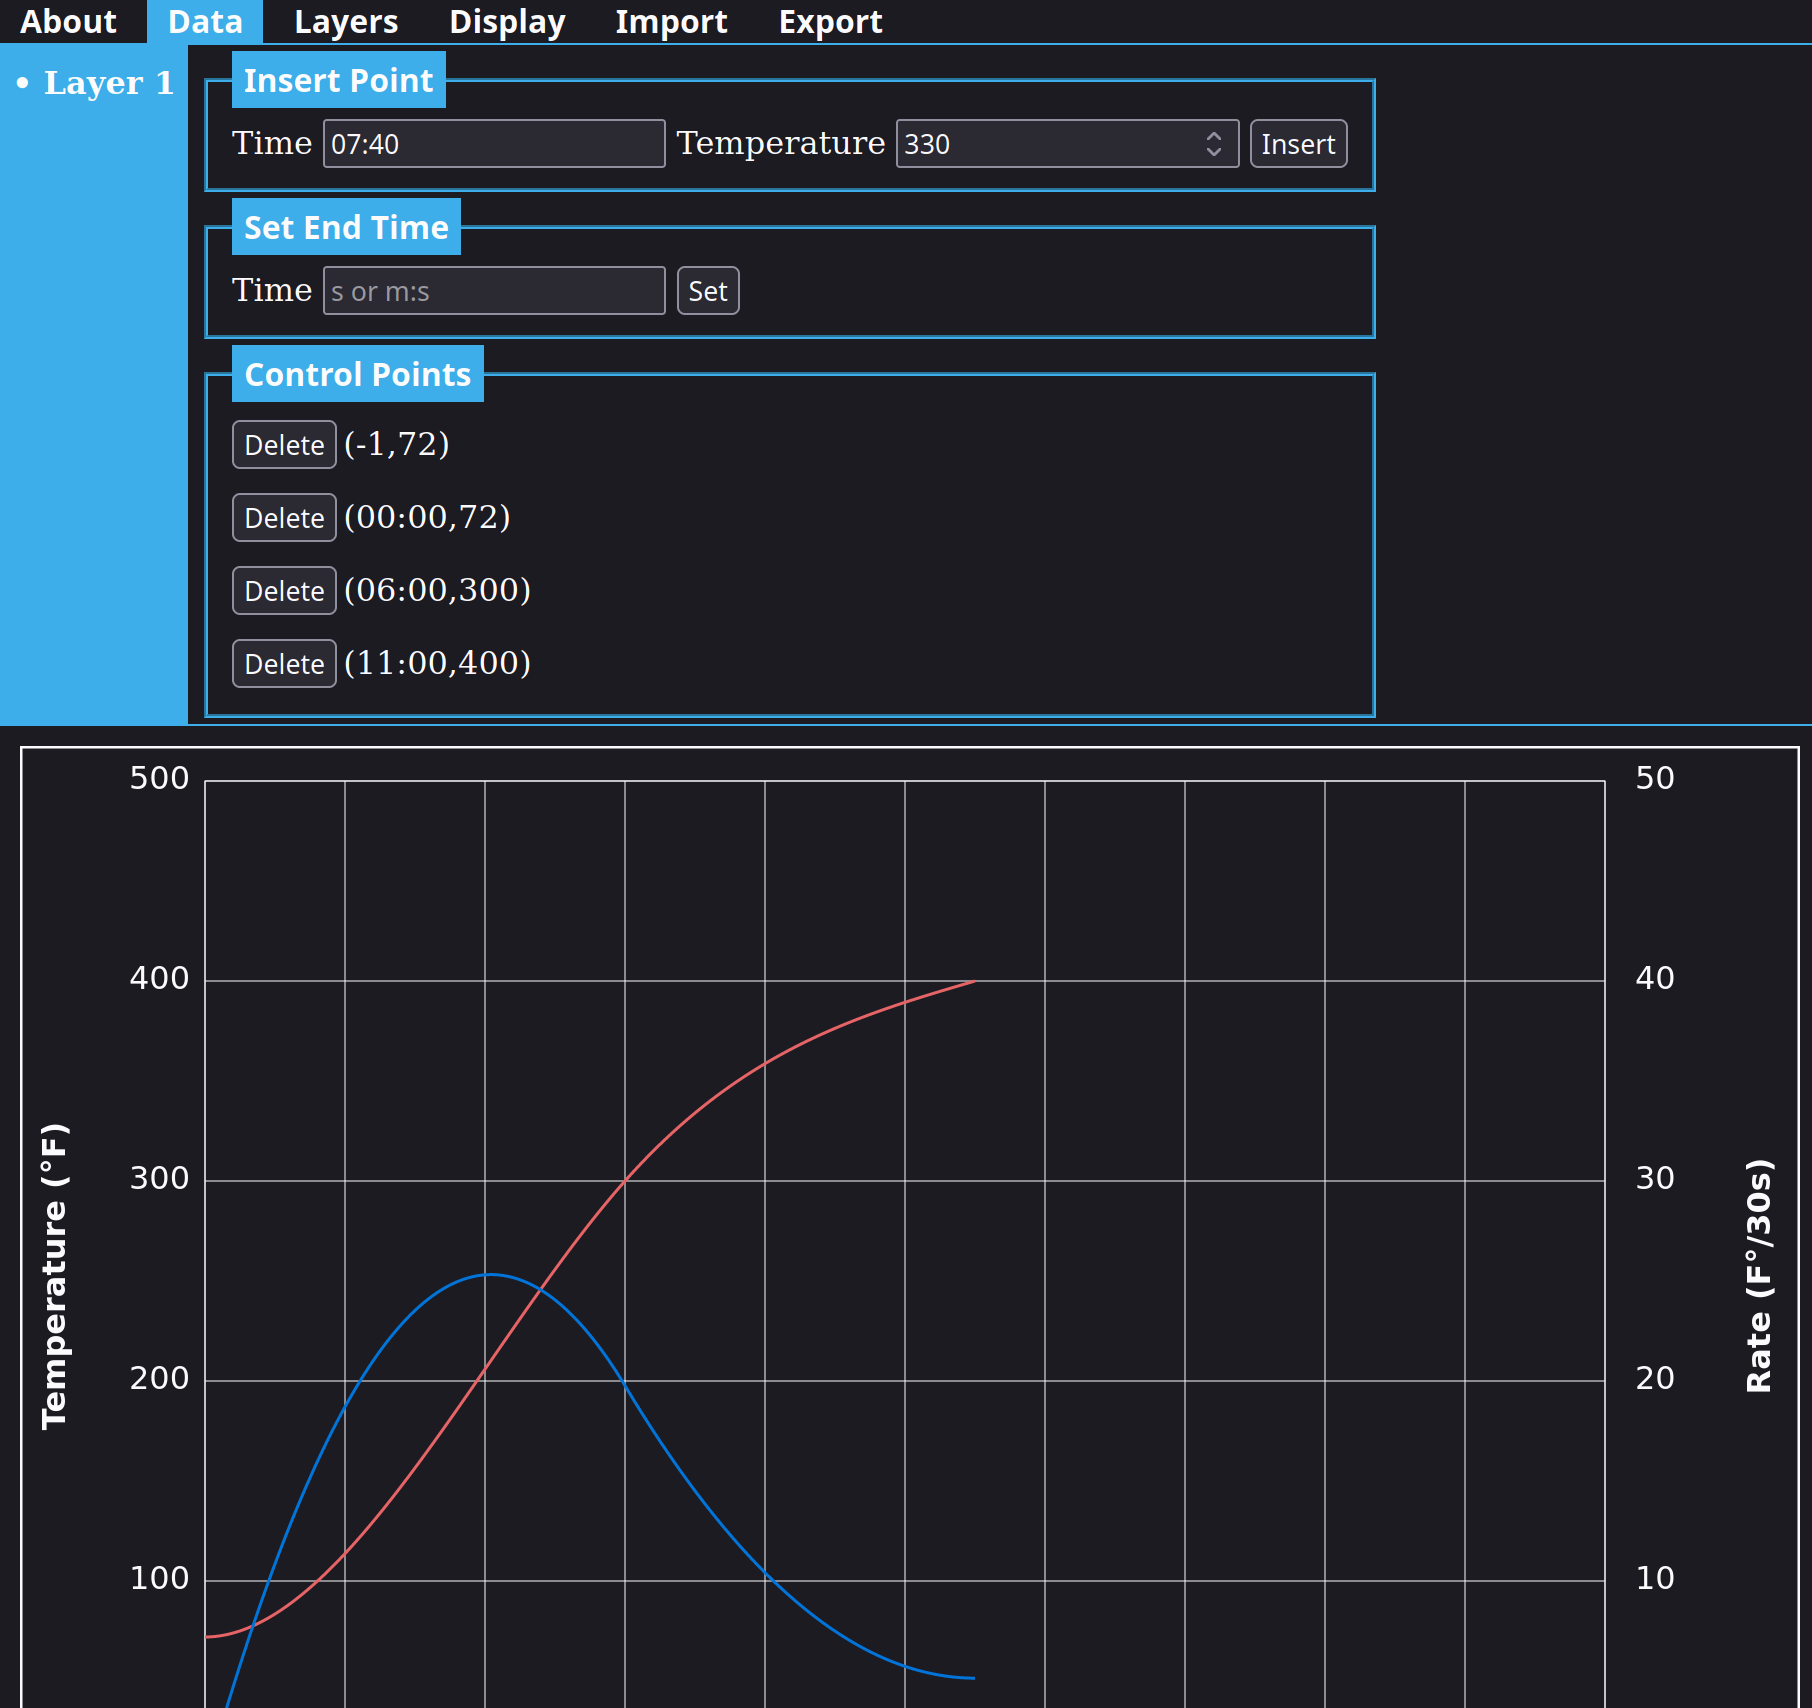
This menu provides the main interface for editing your curves.
A column on the left lists the current layer set and indicates which data series is currently being edited. You will start with an empty data series, but if additional layers are added, you can click in this list to change the series you're editing.
The Insert Point section allows you to specify a time and temperature. To insert a point, type a time value in the Time field, a temperature value in the Temperature field, and click the Insert button.
Time fields differ in behavior depending on whether a : is in the value. Numbers without a : will be interpreted as seconds. Values with a : will interpret numbers to the left of the : as minutes and numbers to the right of the : as seconds. This can make it more convenient to change the time of a point. For example, if you have a time of 5:47 and want to add 30 seconds, you could change this to 5.5:47 (five and a half minutes plus 47 seconds) or 5:77 and these will be normalized 6:17. A negative number can also be used to control the initial slope of the curve. Inserting a point with the same time as an existing point will replace the temperature value at that point.
Once at least two points have been chosen, you should be able to see a graph of the specified curve and a table displaying the same information in a different form.
The Set End Time section allows you to explicitly specify a time for the end of the plan. After entering a value in the Time field, press the Set button. If this is not used, the plan will end at the point with the largest time value. Specifying a time earlier than that point provides a way to chop off the end of the curve without changing its shape. Specifying a later time will generate a plan that extrapolates from the last point in a straight line.
The Control Points section lists all of the points used to define the curve. This is initially empty and will be filled as points are inserted. The Delete button next to each point will remove that point from the Control Points section and place the data back into the Insert Point section. This allows you to see what removing that point does to the curve while also making it convenient to either reinsert that point or edit the values.
The Layers Menu
Updated for 1.2.0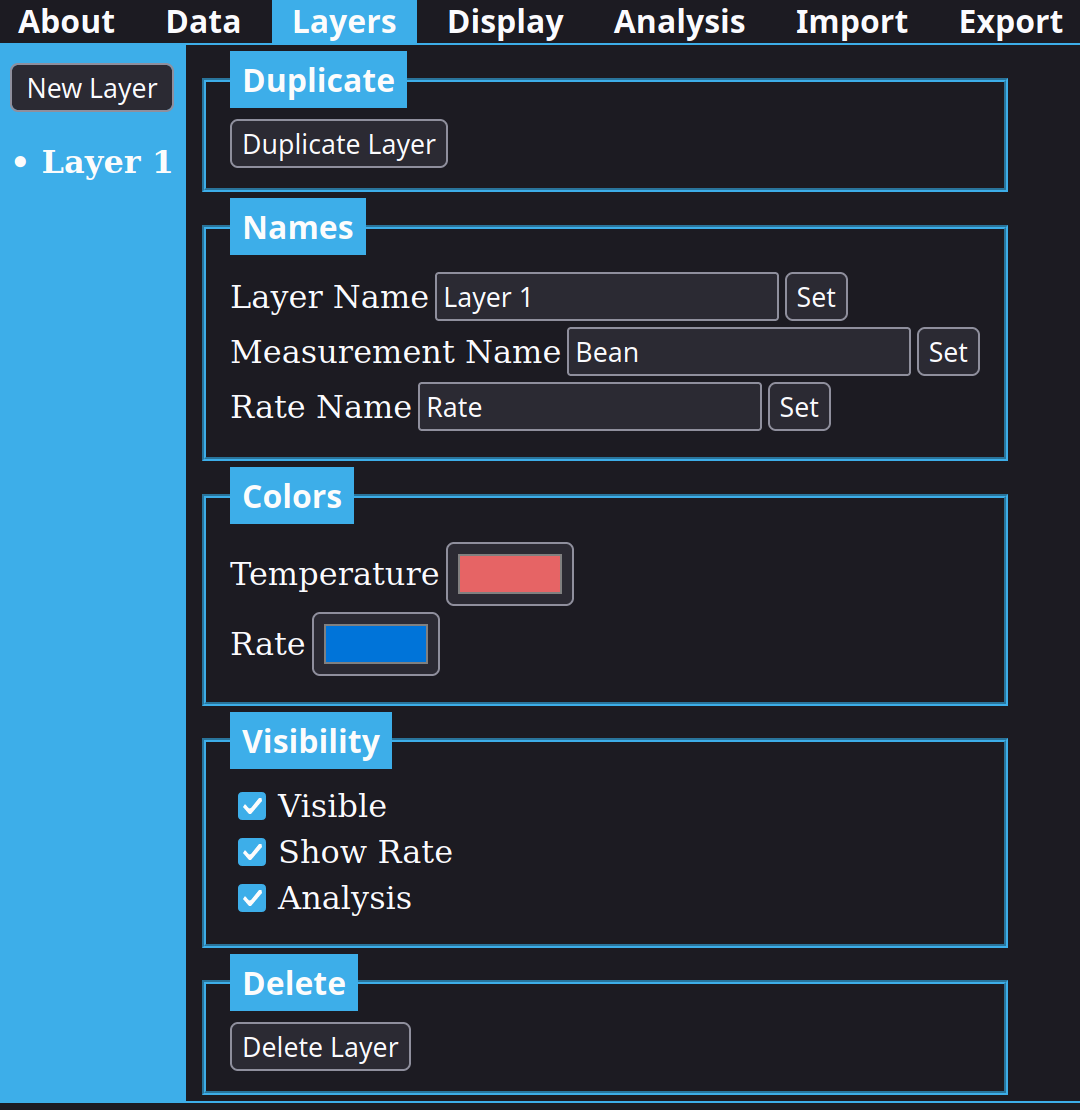
This menu provides a way to create and delete data series as well as edit properties of that data series.
A column on the left has a New Layer button which will create and select a new data series. When more than one layer exists, clicking the layer in this column will select that layer for editing.
The Duplicate section has a button for creating a copy of the current layer. This can be used to keep an old version of a data series for reference while making changes elsewhere.
The Names section provides controls for changing the layer name, the measurement name, and the rate name. The layer name identifies the layer in the columns on the left within the Layers and Data menus. Measurement and rate names change the column headers in the table view as well as in exported data. If you intend to export a plan in Typica XML format, each measurement or rate series should have a unique name. These names should also match your Typica configuration if you intend to use Typica's Profile Translation feature.
The Colors section allows changing line colors for this layer in the graph. Choosing different colors for different layers will make it easier to interpret the graph when working with multiple layers.
The Visibility section provides a way to hide a layer or the rate of change of that layer. If Visible is unchecked, it will be removed from the layer list in the Data menu unless that layer is the currently selected layer. The Analysis check box in this section controls if this layer is included in the analysis report.
The Delete section provides a button to delete the currently selected layer. If only one layer exists, a new layer will be created to replace it. This can be used to quickly clear a plan and start over. If you've created several layers and would like to start over, using your browser's refresh feature will be faster than repeatedly clicking Delete, but both approaches work.
The Display Menu
Updated for 1.1.0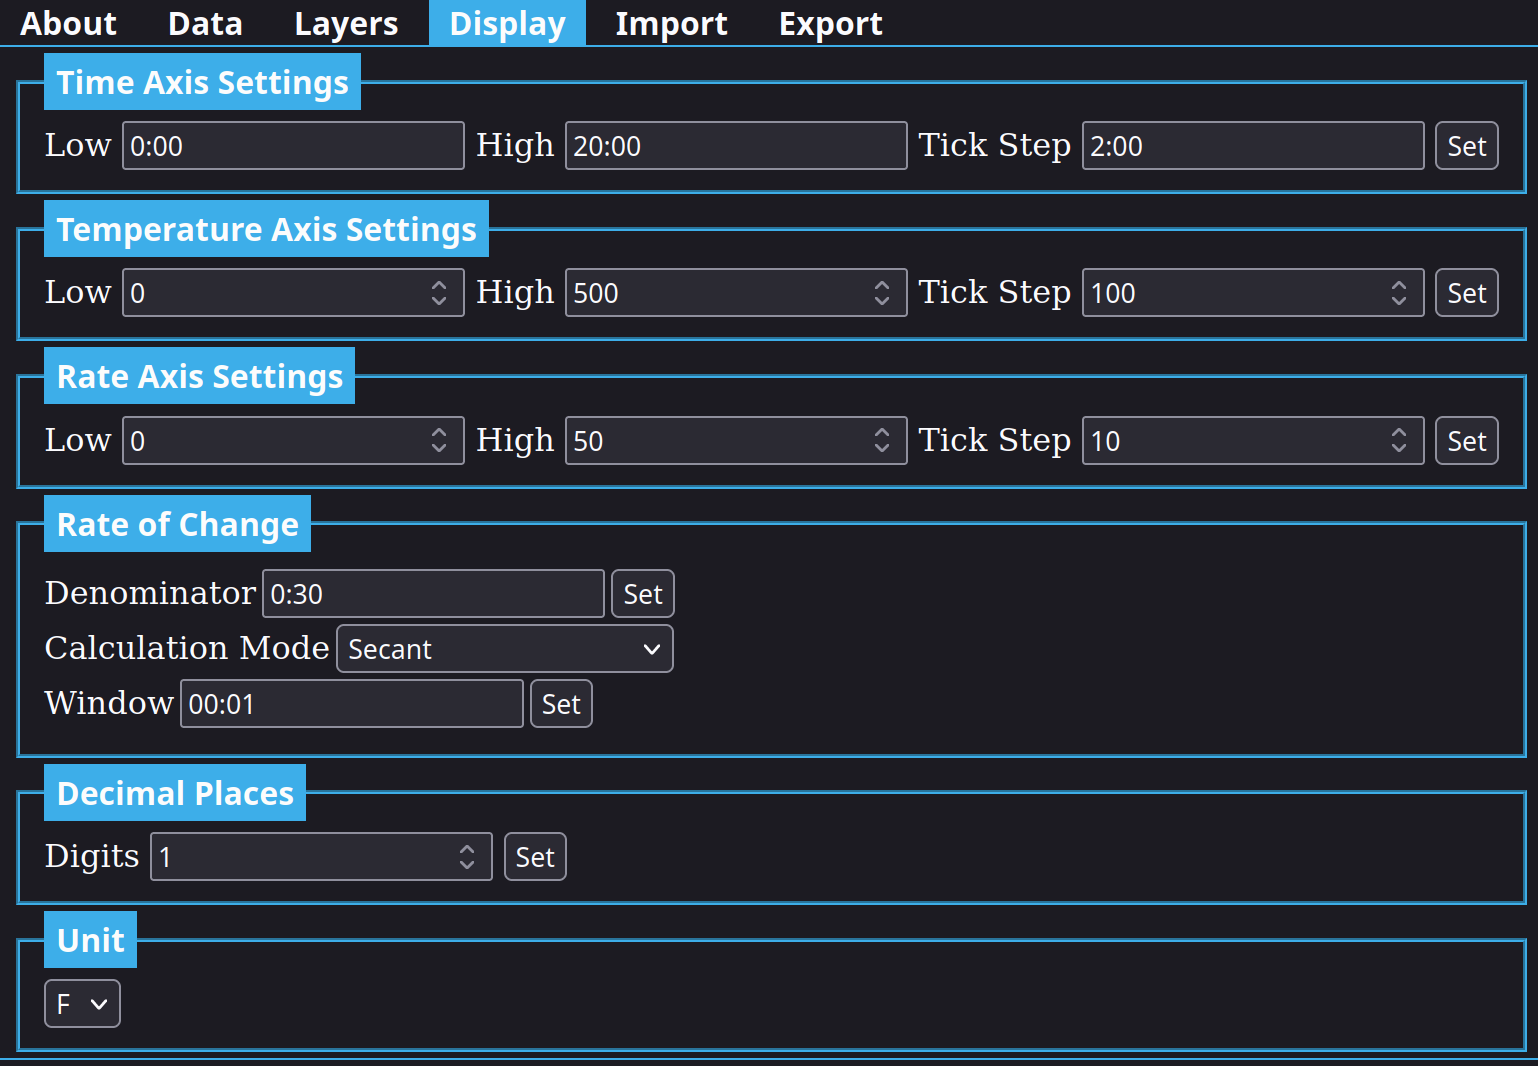
The Display menu provides controls for changing various properties of the graph and table views. Values set here are saved and will be restored the next time you use CRUCS, so it's recommended to take the time to set this up as you'd like to see the data.
Time Axis Settings allows setting minimum and maximum displayed times in the graph as well as the spacing between grid lines. This defaults to 20 minutes, but people using faster roasting machines or who avoid darker roasts may want to set a significantly lower maximum time.
Temperature Axis Settings allows setting minimum and maximum displayed temperatures in the graph as well as spacing between grid lines. This defaults to a 500 degree range, but people who prefer to roast with measurements in Celsius may want a lower maximum value. If your plans always model turnaround, a higher minimum value may also be desired. Changing the time and temperature axis settings can also allow zooming in on part of a plan.
Rate Axis Settings allows changing the range and line spacing for the Rate axis. This defaults to a 50 degree range.
Rate of Change contains setting for calculating rate of change data series. A rate of change is always a fraction of the change in the measurement value divided by a change in time. For coffee roasting, the natural unit is degrees per second, which can be displayed by setting the Denominator value to 0:01, but some peoiple prefer degrees per minute, available by setting this value to to 01:00. The default is 0:30, which is convenient for people recording data manually on paper.The larger this value is, the greater the range you'll want in Rate Axis Settings. There are also two calculation modes. Secant calculates rate of change by using the slope of a line connecting each point to a point earlier in the data series specified by the value in Window. Windowed Regression mode instead uses the slope of a least squares fit line drawn over a specified window. This is more useful when working with imported data.
Decimal Places controls how many digits will be displayed after decimal points. The default is 1.
Unit can be set to F or C. People who prefer to work in Celsius and intend to export data in Typica XML format should set this value appropriately. Failure to do so will result in data being misinterpreted when opening the file in Typica.
The Analysis Menu
New in 1.2.0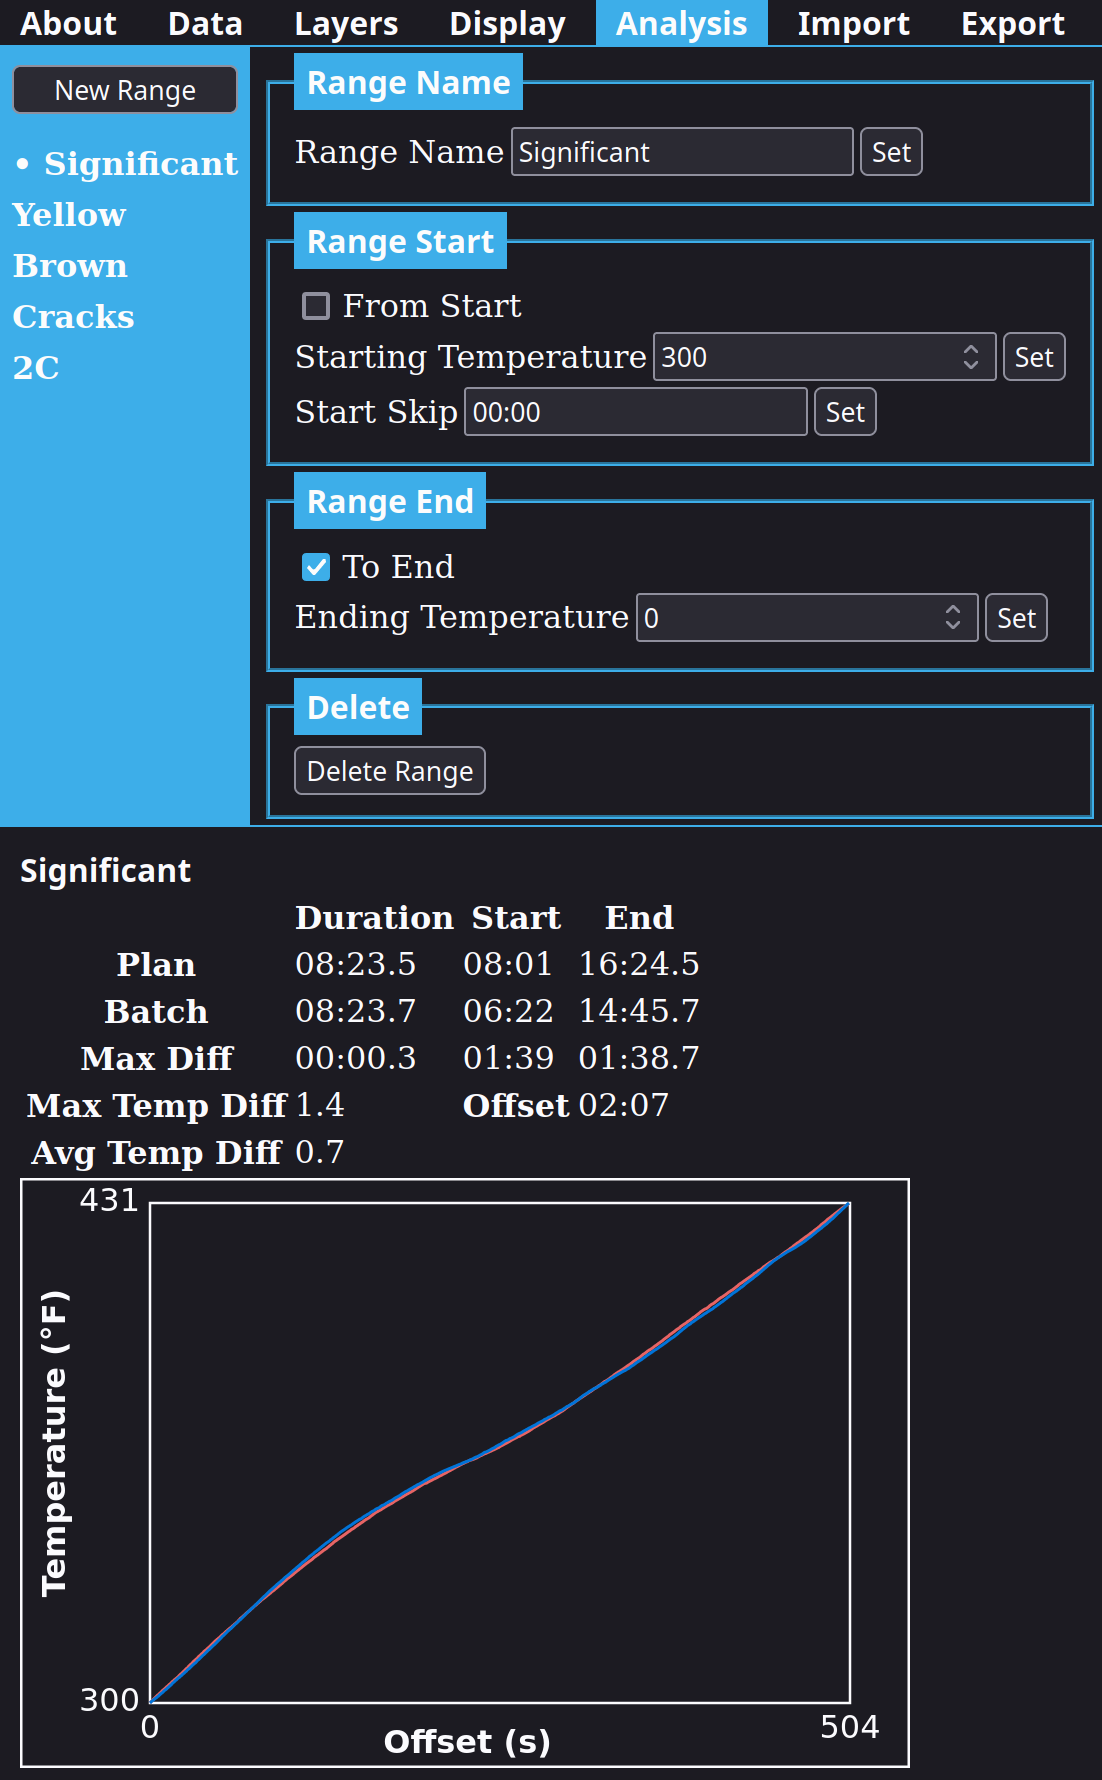
The Analysis menu allows you to use profile translation analysis to compare multiple roasting plans or data from multiple batches within distinct temperature ranges.
The New Range button at the top left adds a new range to be displayed in the analysis report. The list below this button allows you to select a range to edit any of its properties.
The controls to the right show the definition of the currently selected range and allow changing any of the range's settings.
Range Name is displayed in the analysis report and in the list of ranges. You must press the Set button for changes in this field to take effect.
Range Start provides three settings. The From Start check box indicates that this range should take effect from the start of the roast. If this is checked, the other settings do not apply. Starting Temperature allows the start of the range to be defined as when a data series ascends through that given temperature the first time. If From Start is checked when the Set button next to Starting Temperature is activated, this will be unchecked. The Set button must be clicked for changes to take effect. The Start Skip setting can be used to ignore data from the start of the roast. For example, if your preheat or between batch protocol calls for starting a batch at a temperature very close to the temperature at the start of a range, you might have data in which an ascent through that temperature is recorded at the start of the roast. Using the Start Skip setting to ignore the first few seconds of the roast is enough to correct such early range start detections. You must use the Set button for changes to this setting to take effect.
Range End provides access to two ways to define the end of a range. The To End check box indicates that this range should continue until the end of the batch. Ending Temperature will instead look for the first ascent through the given temperature that occurs after the start of the range. You must press the Set button for changes here to take effect and if the To End check box has been checked, pressing the Set button next to Ending Temperature will unckeck that so the new setting can take effect.
Delete provides the Delete Range button which deletes the currently selected range. When deleting the last range, a new range with default settings will be created.
The analysis report replaces the normal view of roasting data with a section for each currently defined range. After the name of the range is a table showing a row for each layer under analysis with the range duration, start time, and end time, along with the maximum difference (longest duration minus shortest duration, latest time minus earliest time). The next row provides the maximum temperature difference and the time offset within the range at which this occurs. Finally, an average temperature difference within the range is provided. That average temperature is based on 1 second sampling for a duration matching the series with the shortest duration in the range and uses the difference between the largest and smallest values across all data series at each offset. Below this table is a graph showing all data series under analysis within that range.
The Import Menu
Updated for 1.1.0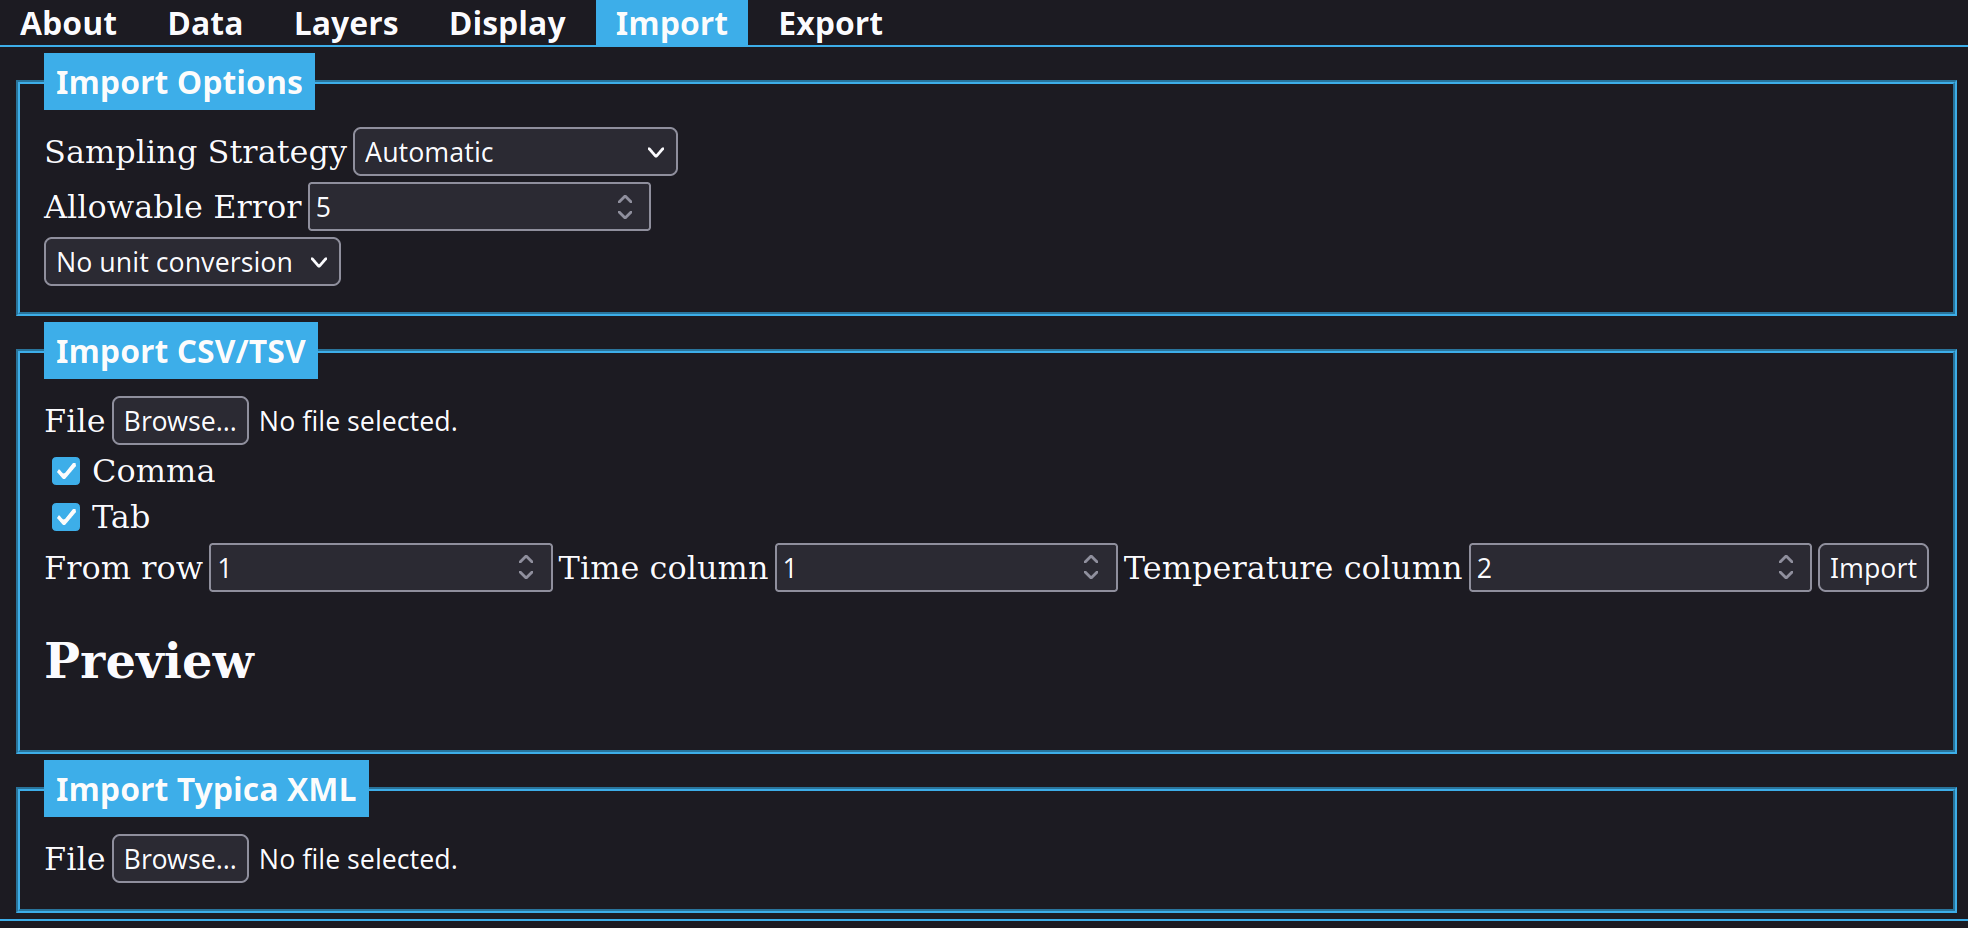
The Import menu provides controls for loading data from your files in either CSV or Typica XML formats. These settings are saved.
Import Options can be used to control sampling settings and unit conversions.
Sampling Strategy provides several ways to limit the number of control points created.
- None creates a control point for every data point in the imported file. This can be used for manual fitting when other options do not perform acceptably well and is also useful when converting between CSV and Typica XML formats.
- Automatic attempts to fit a curve such that each second varies by no more than the specied Allowable Error. The first and last measurements will always be imported exactly. Setting a higher value tends to result in fewer control points for easier editing.
- Regular Time creates a control point at regular time intervals.
- Temperature Change creates a control point when the temperature has changed by at least the specified Temperature Span value.
There is a control for specifying unit conversions. The default is no unit conversion, but if your data file contains measurements in a unit other than the one you prefer to work in, you can convert from Fahrenheit to Celsius or from Celsius to Fahrenheit. This is currently only supported for CSV imports. Measurements in Typica XML format are always in Fahrenheit.
The Import CSV/TSV section provides a button for selecting your file. Once a file is selected, the Preview section will be filled in with a few lines from the top of the selected file. Check boxes are available to explicitly specify the use of a comma or a tab as the field delimiter, but for most files it should be fine to leave both available. You can use the preview to see which row to start on if measurements do not start immediately. Column numbers are also shown to confirm which column you can find time values in and which column has the temperatures you want to import. Clicking the Import button will load data. If the current layer is empty, the data will be imported to that layer. Otherwise, a new layer will be created. If you want to load mulitple data series, you can change the temperature column and click Import again.
The Import Typica XML section only provides a button for selecting your file. Only temperature data will be loaded, and if multiple series are stored in the file, each will be loaded into a separate layer.
The Export Menu
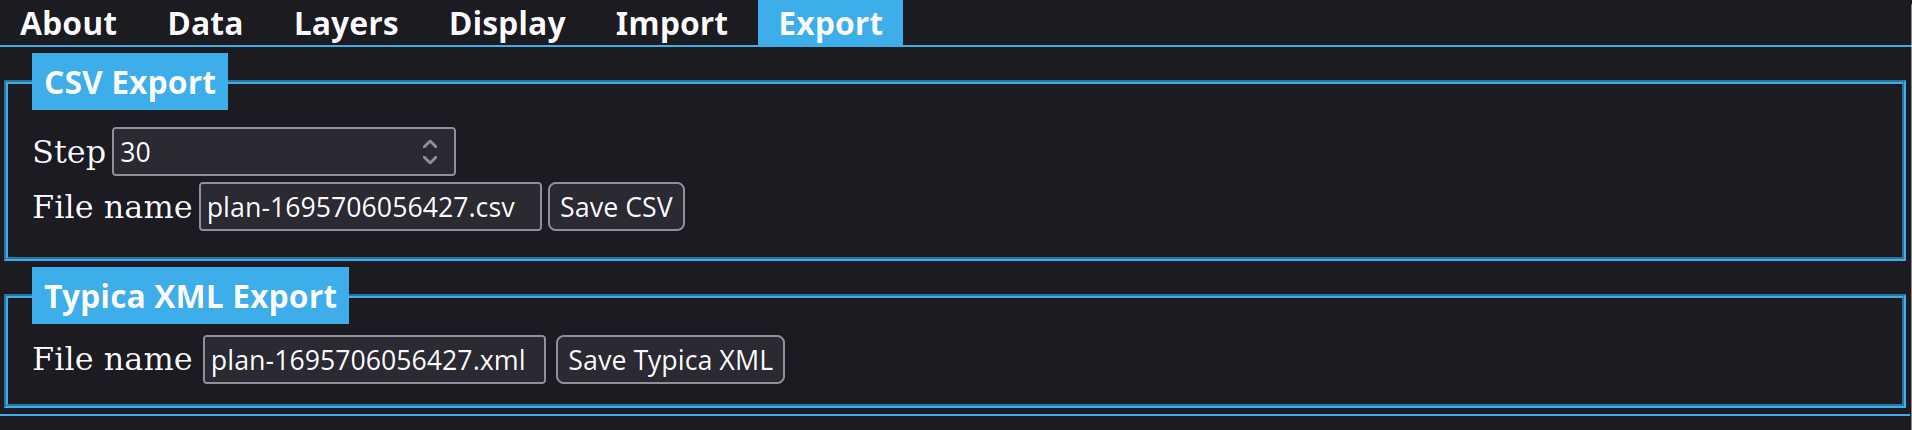
The Export menu provides controls for exporting your roasting plans to a file you can load in the data logging software of your choice provided your choice can read data in CSV or Typica XML formats.
The CSV Export section allows you to set the number of seconds between output lines by changing the value of Step. This defaults to 30, but can be set lower if your intended use is loading into an automated data logger. The File name indicates what your saved file will be named. You can change this before clicking the Save CSV button.
The Typica XML Export section only has a field for editing the name of the file that will be saved when clicking the Save Typica XML button. CRUCS extends the Typica XML format with additional data that Typica currently ignores, but this allows CRUCS to restore the control points and layer properties exactly if the exported file is later imported.
Privacy
All of the functionality in CRUCS is contained in a single file with HTML, CSS, and Javascript. Once that file is loaded, you can create roasting plans, import data, export data, and change settings without any of that information being sent back to a server. If your browser supports saving the page, you can save a copy on your own computer to use locally even without a connection to the Internet, though doing so means that later on you may not be using the latest version. Please don't re-host that elsewhere. If you choose to support CRUCS financially, my payment processor Stripe will leave cookies, but these can be cleared without worry. Some settings and use statistics are saved in your browser's local storage, but these are never sent off your computer.
I don't want your data.